When you want to prepare your 3D visualizations for publication in print/PDF you typically want to convert them into a vector graphics format. Three.js is a JavaScript library for creating 3D graphics that can be easily used to create vector graphics images in SVG format from 3D visualizations. Here is an example of how to achieve this -- and you can modify the example right in your browser!
The Story
Last year, I created a 3D-visualization of the greatest commond divisor function. Then, a few weeks ago, I wanted to take snapshots of the visualization for inclusion in a research paper I was writing. However, as the research papers was intended for print/PDF publication, I was not satisfied with rasterizing the image (i.e., "taking a screenshot"). I wanted to have a vector graphics version of the image, especially since my visualization consisted entirely of lines. Ideally, I wanted to have the image in SVG format so that I could edit the result in Inkscape, my favorite program for creating mathematical illustrations. Unfortunately, Sage, the computer algebra system in which I had originally prepared the visualization, does (at the time of this writing) not support exporting 3D plots in a vector graphics format. So I had to find a different tool.
Three.js came to the rescue. Three.js is a fantastic JavaScript library for creating 3D graphics in the browser. It is mature, easy to use, has a large community and a creator, Ricardo Cabello, who is extremely helpful. Moreover, I think scientific publishing needs to move away from the PDF as its main medium and start creating web-first publications for the web browser -- very much in the spirit of, e.g., MathJax and Substance. So, getting my feet wet with three.js was certainly a worthwhile investment.
In my opinion, the three.js version turned out much nicer than the original. Just as with the original version, you can modify the code producing the visualization right in the browser. However, in contrast to the Sage-based version, there is no need for clunky Java applets to do the rendering and there is no dependency on a Sage Cell server that benevolently does all the computation for the reader of the blog post -- now, everything happens right inside the reader's browser, which makes these kind of interactive documents far easier to host. And of course, you can now take SVG snapshots of the visualization, which was the motivation for the whole exercise.
So, let's move on to the graphics and code.
The 3D Visualization
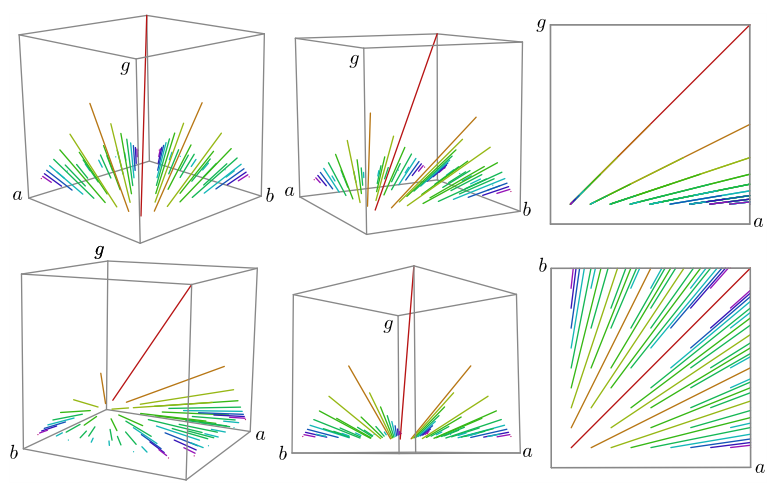
Below is a graph of the greates common divisor function. See this blog post and this expository paper for the math behind this picture. Use the mouse to zoom and rotate.
To take an SVG snapshot of this picture, click here: SVG snapshot.
The SVG Snapshot
This is a static SVG snapshot of the 3D image above. The SVG source is shown below. Paste it into an .svg file and open that in Inkscape for editing. This post-processing by hand is extremely useful!
The Code
Here is the code for the visualization. The language is CoffeeScript. Feel free to experiment and change the code. To reload the visualization with the updated code, click: Run!
Naturally, when working on a project of your own, you will want to have the code on your own system. If you want to use this example as a template to start from, feel free to clone my GitHub repository fbreuer/threejs-examples.
The above code uses both the SVGRenderer and OrbitControls which are not part of the standard three.js library but can instead be found in the examples directory of official three.js repository. This also means that they have some limitations. For example, the SVGRenderer does not support all features of the standard three.js renderers and some fiddling may be required.
Next Steps
Of course this is not the end of the story. Inspired by this success, I already have big plans for a next visualization project based on research papers I am currently writing with Dennis Eichhorn and Brandt Kronholm. I also plan to take a closer look at MathBox, which is a wonderful library for math visualization based on three.js.