These are notes for a talk I gave both in my course at SF State and at the teach-in against police violence at UC Berkeley. The talk at the teach-in found its way on IndyMedia and YouTube (Pt 1 2).
In a democracy, people are fighting all the time over control of the political agenda. Media campaigns, protests and lobbying are all examples of people trying to shape the political discourse. They seek to get “the public” to discuss a topic they care about, they seek to shift the focus of the current political discussion towards the points they think are important or they may even want to throw up a smokescreen to divert the public from a topic they consider dangerous for them. This process is vital for a democracy to work. In fact, I want to present a mathematical argument that supports the following bold claim: This process is more important for a democracy than voting! And perhaps the most amazing thing about this observation is that this is a direct consequence of the geometry of voting.
Policies as points in space
Political choices can often be represented by points in space. By this I mean that often, all the different policies that can be adopted with regard to a given political issue can be represented by different points in space.
As an example, let us consider budget decisions. A state’s budget can be represented by three numbers:
- the state’s revenue (e.g. taxes)
- the state’s expenditures (e.g. public spending)
- the state’s deficit
deficit = spending - taxes.
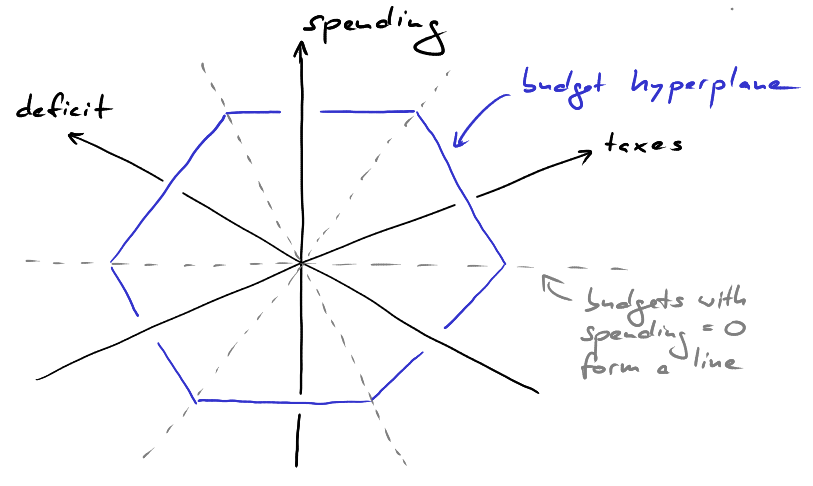
This equation defines a plane in three dimensional space. All possible budgets lie in this hyperplane. To visualize how this looks consider the following three dimensional coordinate system. The axes represent spending, taxes and deficit. The budget hyperplane lies slanted in space. Its intersections with the three coordinate hyperplanes are shown as dashed lines. For example, the horizontal dashed line is the set of budgets with spending = 0. It is a diagonal in the plane spanned by the deficit and taxes axes. Similarly, the other two dashed lines are diagonals in the deficit/spending and spending/taxes coordinate hyperplanes.
As we have seen, the set of all budgets with spending = 0 forms a line in the plane of all possible budgets. Increasing or decreasing spending by, say, 1 dollar corresponds to translating this line in the plane. Taking all translates by $k$ dollars, we obatin a family of parallel lines. And if we repeat this for the lines given by taxes = 0 and deficit = 0, we obtain a triangulation of the budget plane as shown below.
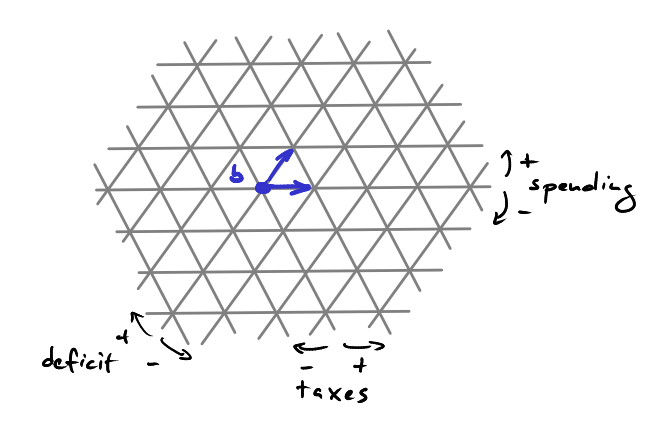
This picture shows a part of this triangular lattice. It allows us to visualize what happens if we change a given budget $b$. Say $b$ is given by a spending of 3 trillion dollars, tax revenues of 2 trillion dollars and a deficit of 1 trillion dollars and suppose we increase tax revenues by 1 dollar. This corresponds to moving from $b$ to the line given by 1 trillion and one dollar of tax revenues. However, we have to make a choice here. Do we use that one extra dollar to lower the deficit or increase spending? If we go “left” in the picture, we stay on a line where the deficit remains constant but we move from one “spending line” to the next thus increasing spending. On the other hand, if we go “right” we keep spending constant and decrease the deficit.
Now that we have a means to visualize how different budget decisions relate to each other, we can use that to visualize the current positions of various political actors in the US with regard to the federal budget.
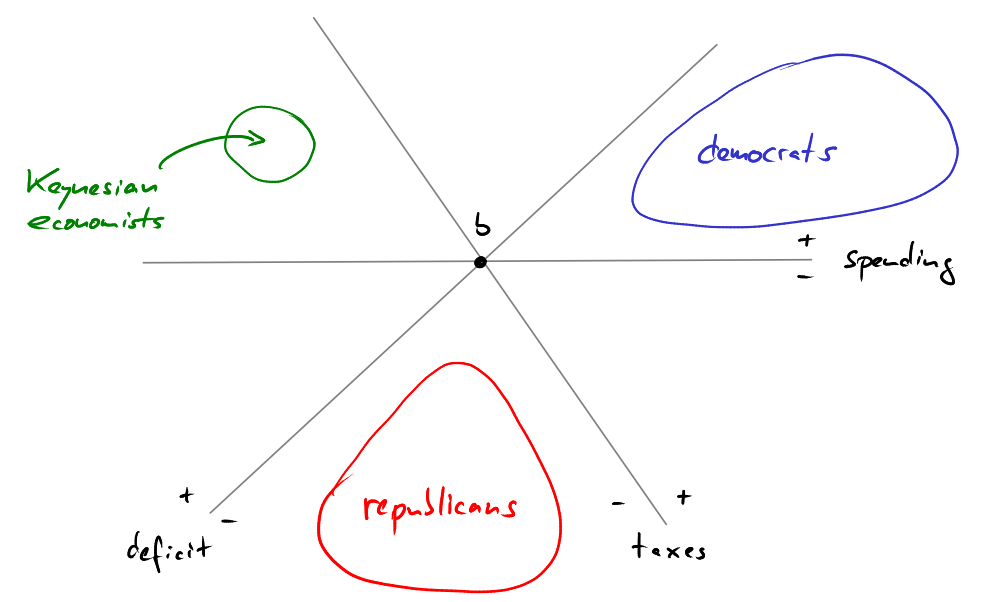
We place the 2011 federal budget in the center of our picture at the point labeled $b$. Next we draw the three lines through $b$ along which spending, taxes and deficit are constant, respectively. Both, the democrats and the republicans want to decrease the deficit. So if you asked a democrat or republican where their ideal 2012 budget would be, then they would tell you that it lies below the deficit line through $b$. Ideally, however, a democrat would like to decrease the deficit by increasing taxes, without decreasing spending. So, qualitatively, a democrat’s ideal policy would lie in the blue region. A republican, on the other hand, would want to reduce spending to finance the decrease in deficit without raising taxes. So a republican’s ideal policy would lie in the red region. There are other people, though, e.g., Keynesian economists, who think that lowering the deficit is not a priority at the moment. They think that it is much more important to stimulate the economy by lowering taxes and increasing spending, even if that means that the deficit has to increase even further. People in this comparatively small group might have an ideal budget somewhere in the green region.
We have now seen how to think geometrically about politics. Now we are going to apply this point of view to analyze the dynamics of the majority vote.
Spatial Voting and the Power of Agenda Control
So far, we have only visualized policies as points in space. Now we come to McKelvey’s theorem, the main result I want to tell you about. To be able to state this theorem, we need to formulate a model of voting, called spatial voting.
As we discussed, every policy corresponds to a point in space. Now, spatial voting simply means the following.
- Voters are asked to decide between two alternatives, the status quo which we call $x$ and a proposed new policy $z$. Voters can vote for either of these two alternatives.
- The alternative with the most votes wins, i.e., we are having a majority vote.
- Every voter has an ideal policy in mind. So the voters can be represented by a set of points in space.
- Finally, we make a very important assumption: Every voter will vote for the alternative closest to his or her ideal policy!
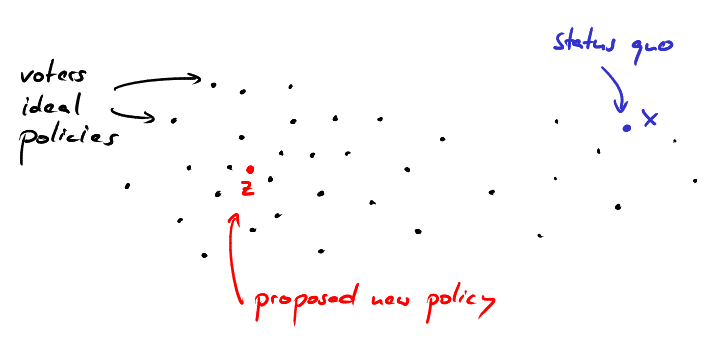
Consider as an example the following picture. The black points represent the ideal policies of all voters. The blue point labeled $x$ marks the status quo, while the red point labeled $z$ marks the proposed new policy. In this example, most voters are going to vote for $z$ as $z$ is closer to their ideal than $x$. As we are running a majority vote, this means that $z$ is going to be approved and will become the new policy.
Now we can state McKelvey’s theorem.
Theorem. (McKelvey 1976) For every status quo $x$ and every other policy $z$ there exist policies $y_1,y_2,\ldots,y_k$ such that
$x$ loses against $y_1$ which loses against $y_2$ which loses against $y_3$ … which loses against $y_{k-1}$ which loses against $y_k$ which loses against $z$
in the majority vote.
What does this mean? Suppose there were someone with complete control of the agenda. This agenda controller would have absolute control over which new policies are proposed. Whenever the agenda controllers proposes a new policy, the voters would get to vote and the agenda controller would be bound by their decision according to the majority rule. This means that an agenda controller cannot decide anything. All he can control is between which alternatives the voters get to choose.
So, suppose there is an aganda controller and the current status quo is $x$. Suppose further that the agenda controller wants voters to pass a new policy $z$ that he favors (but that everybody else may hate). McKelvey’s theorem now states that there are cleverly devised policies $y_1,\ldots,y_k$ such that the agenda controller can proceed as follows. First, he proposes $y_1$. The voters get to choose between $x$ and $y_1$ and they approve $y_1$ as the new policy because the majority of voters prefers $y_1$ to $x$. Now $y_1$ is the new status quo. Next, the agenda controller proposes $y_2$ and again, the voters prefer $y_2$ over $y_1$ so they are going to adopt $y_2$ as the new status quo of their own free will. The agenda controller continues in this fashion until the voters pass $y_k$ as their new policy. Then he makes his final move and proposes $z$, the policy that he likes but that everybody else hates. However, through his previous moves, he has managed to put the public in a position where the majority actually prefers $z$ to the current status quo $y_k$. And so they are going to approve of $z$ of their own free will.
In this way, someone in control of the political agenda is in complete power, even if he is bound by the majority vote of the population. This explains why, for example, freedom of speech and the right to protest are so important parts of democracy. Protest is a way of getting a certain item on the political agenda, trying to influence the direction that current policy should take. (See here for a recent example.) Conversely, if there is a small elite who dictates the political topic of the day, then this elite will get its way, no matter if vote or not. So the morale of the story is this:
Voting alone does not give the people any power! Just by voting, you can’t control anything. You also have to have a public discussion about political topics and this is what protest is about.
At this point, it is important to stress the difference between the provocative morale that I drew from the story and the statement of the original theorem. The theorem is provably true, but applies only to a very specific abstract model of a society. In reality, no one is in absolute control of the political agenda! And the theorem tells us that this is a very good thing!
So, while the theorem does not apply to western democracies such as the USA, it can still tell us something about the real world, by way of analogy, in just the same way that a good novel can reveal a truth about the world we live in. (See the Q&A section for more about this.)
Now that we have both a formal as well as an intuitive feeling of what McKelvey’s theorem is saying, let us try to get an idea why the theorem should be true.
The Idea behind McKelvey’s Theorem
In this section, I want to give an idea how the sequence of policies $y_1,\ldots,y_k$ are constructed. If you want, this is a proof by example, but of course it is not a complete proof of the theorem. For a thorough proof I refer the interested reader to the literature cited at the end of the Q&A section.
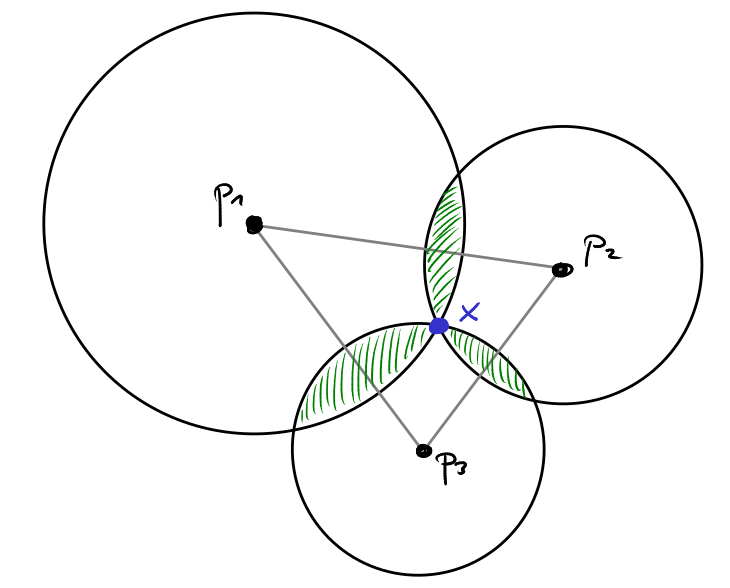
We work with an example in 2 dimensions. There are three voters $v_1,v_2,v_3$ whose ideal policies are given by the three black points $p_1,p_2,p_3$ in the picture. We draw the lines through any pair of these three points. The status quo is given by the blue mark in the center of this triangle formed by the voters’ ideals. So, intuitively, the current status quo $x$ seems like a pretty good compromise between the voters’ preferences.
Which policies defeat the status quo $x$ in a majority vote? Remember that the three voters will vote for the alternative closest to their ideal policy. So, for each voter, we draw a circle around that voter’s ideal policy and we choose the radius of that circle such that the cirlcle passes through the status quo $x$. Let $C_1$ be the circle around voter $v_1$’s ideal policy $p_1$. $v_1$ will prefer any policy $y$ to $x$ that lies strictly inside the circle $C_1$!
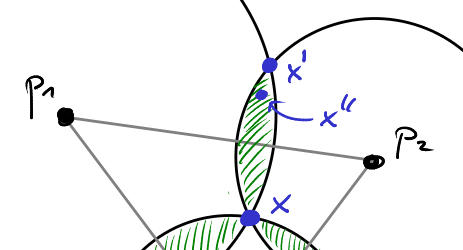
Consequently, the policies that will defeat $x$ lie in the intersection of any two of the circles shown in the picture. The area corresponding to the set of policies that defeat $x$ are shaded green in the picture. As you notice, the shaded area extends outside of the triangle spanned by the three ideal policies $p_1,p_2,p_3$. Let $L_1$ denote the line through $p_1$ and $p_2$. If we reflect $x$ at $L_1$, then we will obtain a point $x’$ at exactly the same distance to $p_1$ and $p_2$ as $x$. If we now move $x’$ inwards for a little bit, the resulting point $x”$ will lie strictly in the interior of both $C_1$ and $C_2$. Thus $x”$ will defeat $x$ in a majority vote, because both voters $v_1$ and $v_2$ will like $x”$ slightly bettern than $x$. Note, however, that for $v_3$ the new policy $x”$ is much worse than the status quo $x$. Since we are working with a majority vote, however, this is not taken into account.
As it turns out, this construction always works! We summarize this observation as follows.
For any policy $x$ and any line $L$ through two of the voters’ ideal policies, the policy $x”$ obtained by first reflecting $x$ at $L$ and then moving the reflected point back towards $L$ a tiny bit, will always defeat $x$ in a majority vote. Typically, $x”$ will be “slightly better” than $x$ for two of the voters and much worse for the third voter.
This observation is the staples of the agenda controller’s strategy for manipulating the voters. Phrased provocatively, the agenda controller’s strategy is this:
Play off different groups of voters against each other! Offer a majority of voters marginal incentives to hurt a minority really bad!
So how can an agenda controller use this strategy to get voters to vote for his favorite policy? The following figure tells it all.
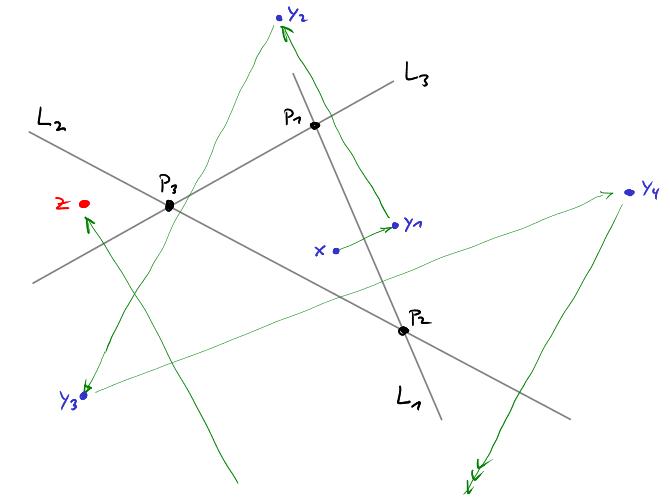
We start with a status quo $x$. This we reflect $x$ along the line $L_1$ through $p_1$ and $p_2$ by playing off voters $v_1$ and $v_2$ against voter $v_3$ to get to a new policy $y_1$. Next, we reflect $y_1$ along $L_3$ by playing off $p_1$ and $p_3$ against $p_2$ to get to $y_2$. Then, we reflect $y_2$ along $L_2$, by playing off $p_2$ and $p_3$ against $p_1$. We can keep going in this fashion as long as we like. Note that in each step we give two of our voters a tiny improvement (we move towards their ideal points by a tiny bit) while at the same time making the situation much worse for the third one (we move much further away from his ideal policy). In total, we make the situation worse in every step! So if we continue this process long enough, everybody will be so unhappy with the current policy ($y_k$ will be so far away from all voters’ ideal policies) that everybody will be happy to agree to the policy $z$ that the agenda controller had in mind all along.
I find this proof striking for a number of reasons. First of all, even from this small example, you get a clear idea how the proof will proceed in the general case (even though you need a couple of technical tools like median hyperplanes). Second, for three voters, the proof requires only an elementary geometric construction that (I hope) does not scare off people who do not feel that comfortable around mathematics. Finally, and this is most remarkable, this proof gives clear instructions how someone who wants to manipulate public decision making should go about it: Play off different groups of voters against each other! The fact that many political decisions are two or higher dimensional provides the necessary room to maneuver.
(In fact, I find it striking how similar the manipulative stragtegy suggested by the geometry of voting is to how many agents on the political stage actually behave. To manipulate public opinion, they try to reduce the public discussion on an issue to a one-dimensional problem. To a choice between two alternatives. They try to hide the fact that real world problems are higher-dimensional.)
Conclusion
I hope to have convinced you that there is merit in looking at politics from a geometric point of view. A natural consequence of this point of view is McKelvey’s theorem, which states that an agenda controller can get voters to agree to anything the agenda controller wants of their own free will. Fortunately, there are no perfect agenda controllers in real world democracies! But McKelvey’s theorem reminds us that we had better exercise the freedom we have to shape the political agenda. Because without active political debate, the right to vote alone does not give the public any power at all.
Q&A
There are a great many things more to say about all this. Here are a few of them.Budgets are more complicated than this!
Of course a state’s budget is much more complex than the model I suggested above. There are many more parameters to take into account! The advantage of this model is that it captures the gist of the problem while still being low-dimensional enough so that we can draw something!
There are some assumptions missing from McKelvey’s theorem!
That is true. First of all, McKelvey’s theorem only works in dimensions two and up. If different policies all lie on a line, then McKelvey’s theorem fails. The same thing can happen in higher dimensions if the voters’ individual preferences have a particular pattern. For example, if all voters have the exact same ideal, then agenda control won’t work. The technical assumption I omitted in the above statement, is that the median hyperplanes (whatever that is) of the the voters’ ideal policies do not all intersect in a single point. However, this assumption is not critical for the following reason: By slightly perturbing the voters ideal policies we can always guarantee that this assumption is satisfied. Also, the theorem assumes that the set of policies is all of $\mathbb{R}^n$. This is not true in the budget example, as negative values for taxes or spending do not make sense (a negative deficit is fine, though). But generalizations of McKelvey’s theorem take care of this issue (see below). Finally, the theorem assumes an odd number of voters. McKelvey argues, however, that this makes no difference, as the agenda controller can decide to participate in the vote if and only if his vote is required to make the total number of votes odd.
It should also be mentioned that McKelvey’s theorem assumes that all voters use the Euclidean distance to measure which policies they prefer. However, this assumption is not essential as McKelvey showed in a subsequent paper. (See below.)
What generalizations of McKelvey’s theorem are there?
McKelvey generalized his theorem considerably in subsequent work. For example, he showed that if the set of policies is an arbitrary connected subset $X$ of $\mathbb{R}^n$ and each voter measures with his or her own, private notion of distance (which has to be continuous) then, still, the top cycle of the majority rule is going to be all of $X$ (i.e., agenda control works). He concludes, in his own words:
“Regardless of other voters’ preferences, any one voter with complete information of the other voters’ preferences, control of the agenda, and the ability to cast his own vote as he chooses can always construct majority paths to get anywhere in space.”
Is protest really more important than voting?
The provocative catchphrase that “protest is more important than voting” is meant in the following sense: A political system in which people do not shape the political agenda at all but only go to vote is not democratic. In this sense, active participation in the public political discourse is at least as important as going to vote. This is not to be construed as an excuse not to go voting, however!
Is there a mathematical proof that influencing the political agenda is more important than voting?
No. Mathematics makes statements about abstract models. McKelvey’s theorem makes a statement about a particular abstract model of a society in which the people do not influence the political agenda at all and behave in a predictable way. This statement is provably true. But “mathematics” makes no claim whatsoever about what this statement about an abstract model has to do with reality.
How realistic is the model of society assumed in McKelvey’s theorem?
First of all: I am not a political scientist, and I do not know of any empirical research on this subject. My personal opinion, however, is the following: Western democracies such as the USA do not fit the model of McKelvey’s theorem at all. In particular there are a number of important differences:
- In practice, all actors on the political stage constantly strive to control the agenda! So McKelvey’s theorem does not apply to practical politics, but it offers an unconventional explanation why control of the agenda is so strongly contested.
- The theorem assumes that the agenda controller has complete information about the preferences off all voters. This is not true in practice. However, never before was so much data about personal opinions readily available to anyone with an internet connection. So one could argue that western societies are converging on the condition required for McKelvey’s theorem to apply.
- Voters oppinions change over time. The theorem assumes that opinions are constant. I would guess, though, that the theorem could be extended to account for changing opinions.
- There are few voting processes where voters only decide to aprove or reject a single proposition. Presidential election in the US fit this description but are too closely tied to personality to admit a reasonable parameterization by points in space. In most other public elections, the voters have to decide between many alternatives, so spatial voting does not fit either. In process of passing a bill in congress fits the model accurately, however there voters are constantly trying to control the agenda. Ballot propositions also fit the model, but again, voters have direct influence on the available propositions through the initiative system.
- As mentioned above, the theorem makes a couple of additional technical assumptions. However, I do not think that these are essential, especially with regard to McKelvey generalizations of his theorem.
- There is one technical assumption that deserves special mention: continuity. I do not think that it is that much of a constraint to assume that voters preferences are continuous. Rather, I think it is a significant departure from reality to assume that the space of all policies is a continuum in the first place. For a budget, this is simply false: Two budgets cannot differ infinitessimally - they can only differ by cents.
There is no policy that cannot be defeated by any other policy in a majority vote, right?
Exactly! But instead of looking for a policy that cannot be defeated, we can go for the policy that is least likely to be defeated! This is the policy for which the shaded green area in circle picture above is smallest. As it turns out this so-called “strong point” of the majority game lies roughly in the center of all voters’ ideal points. More precisely, it is given by a convex combination of the voters’ preferences, where the weights of the convex combination are given by spatial power indices of the voters. This means that centrist voters have more influence on the strong point than extremist voters. (Owen and Shapley 1989)
Where can I read more on this?
I recommend the excellent article by P.D. Straffin Jr. in the Handbook of Game Theory and Richard McKelvey’s original articles on the subject.
- Straffin, P. D. J. (1994). Power and stability in politics. Handbook of Game Theory with Economic Applications Volume 2 (Vol. 2, pp. 1127-1151). Elsevier.
- McKelvey, R. D. (1979). General Conditions for Global Intransitivities in Formal Voting Models. Econometrica, 47(5), 1085-1112.
- McKelvey, R. D. (1976). Intransitivities in multidimensional voting models and some implications for agenda control. Journal of Economic Theory, 12, 472-482.